Continuous Profiling with Pyroscope
DevOps & CI/CD diagram · made in Skemio
What it shows
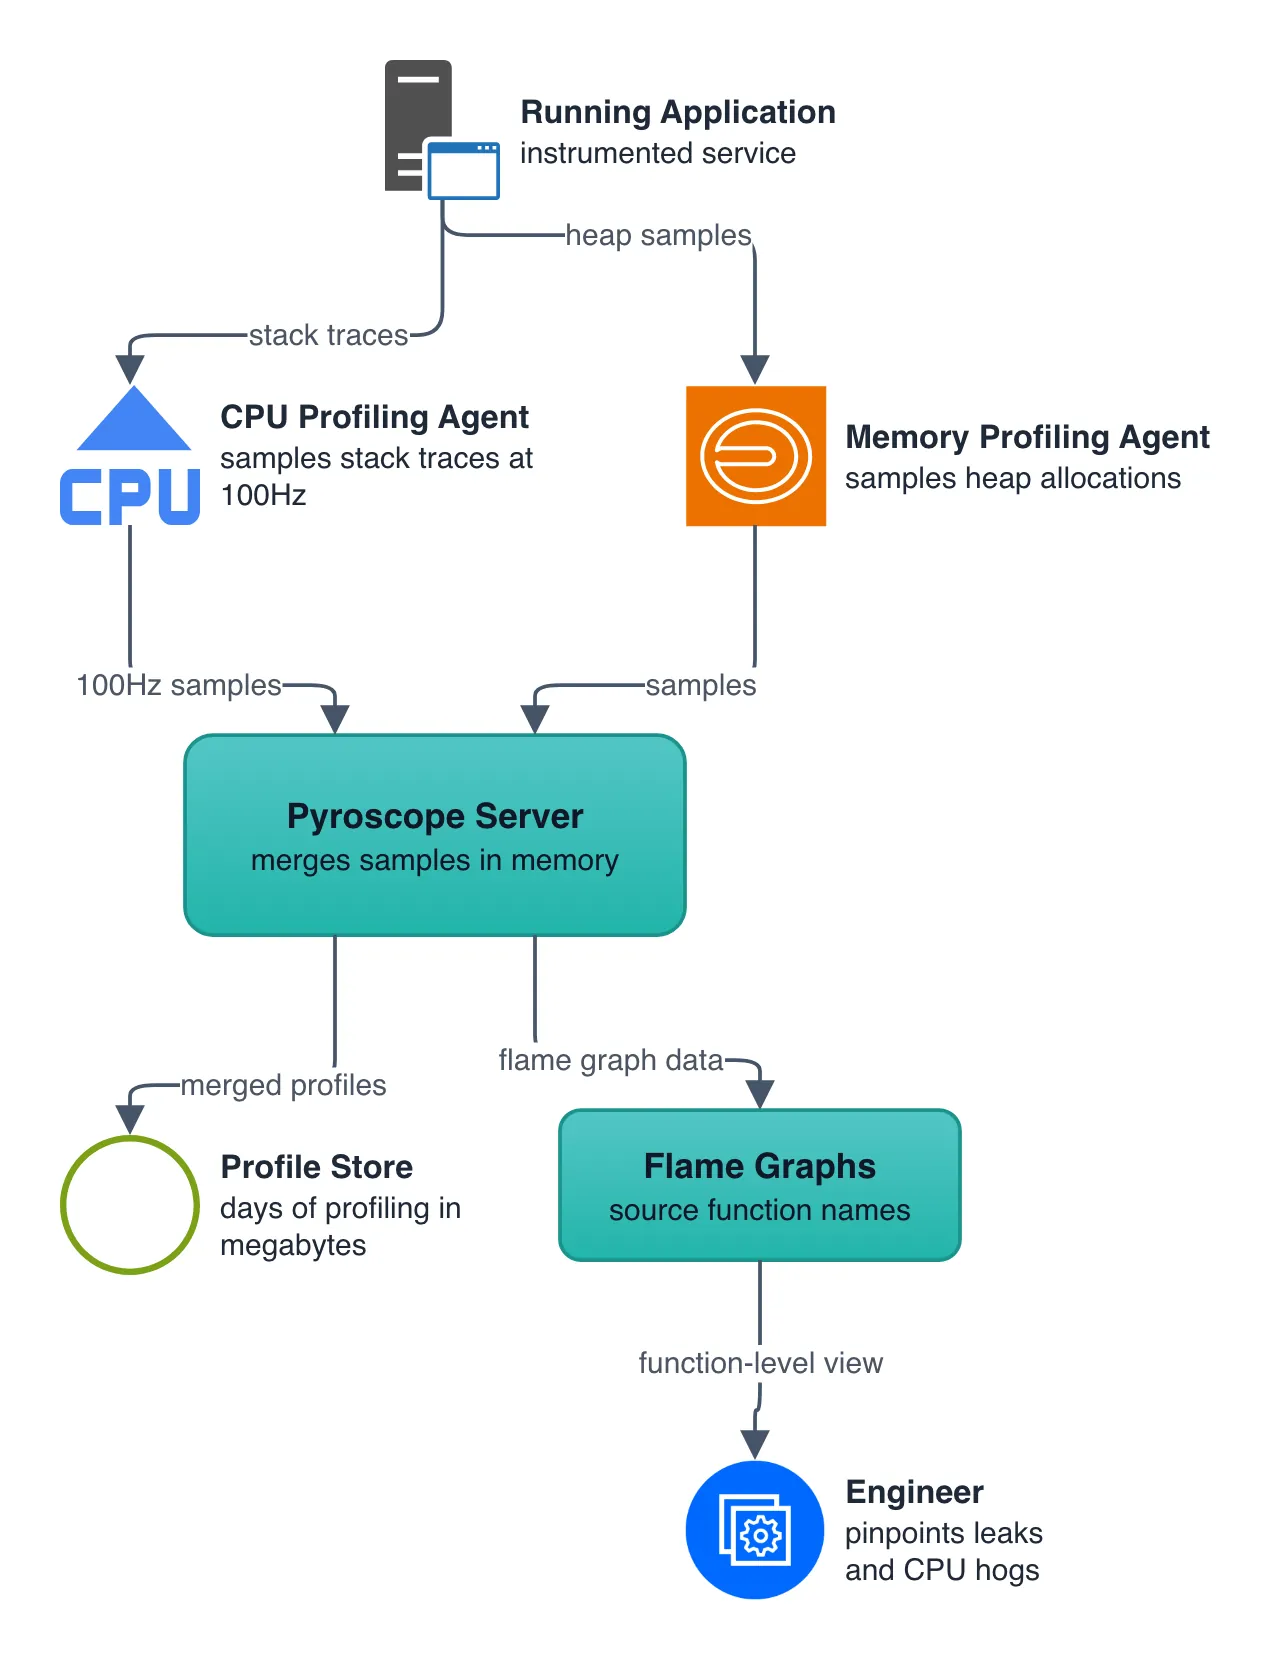
- Samples stack traces at 100Hz with less than 2% compute performance overhead
- Merges flame graph samples in memory to store days of profiling in megabytes
- Pinpoints memory leaks and CPU hogs directly down to the source function name
The takeaway
Continuous profiling fills the gap between metrics and traces by surfacing line-by-line runtime waste.
- #Observability
- #ContinuousProfiling
- #SRE
- #DevOps
- #PerformanceTuning
- #Architecture