Real-Time Metrics with Kafka and ClickHouse
System Design diagram · made in Skemio
What it shows
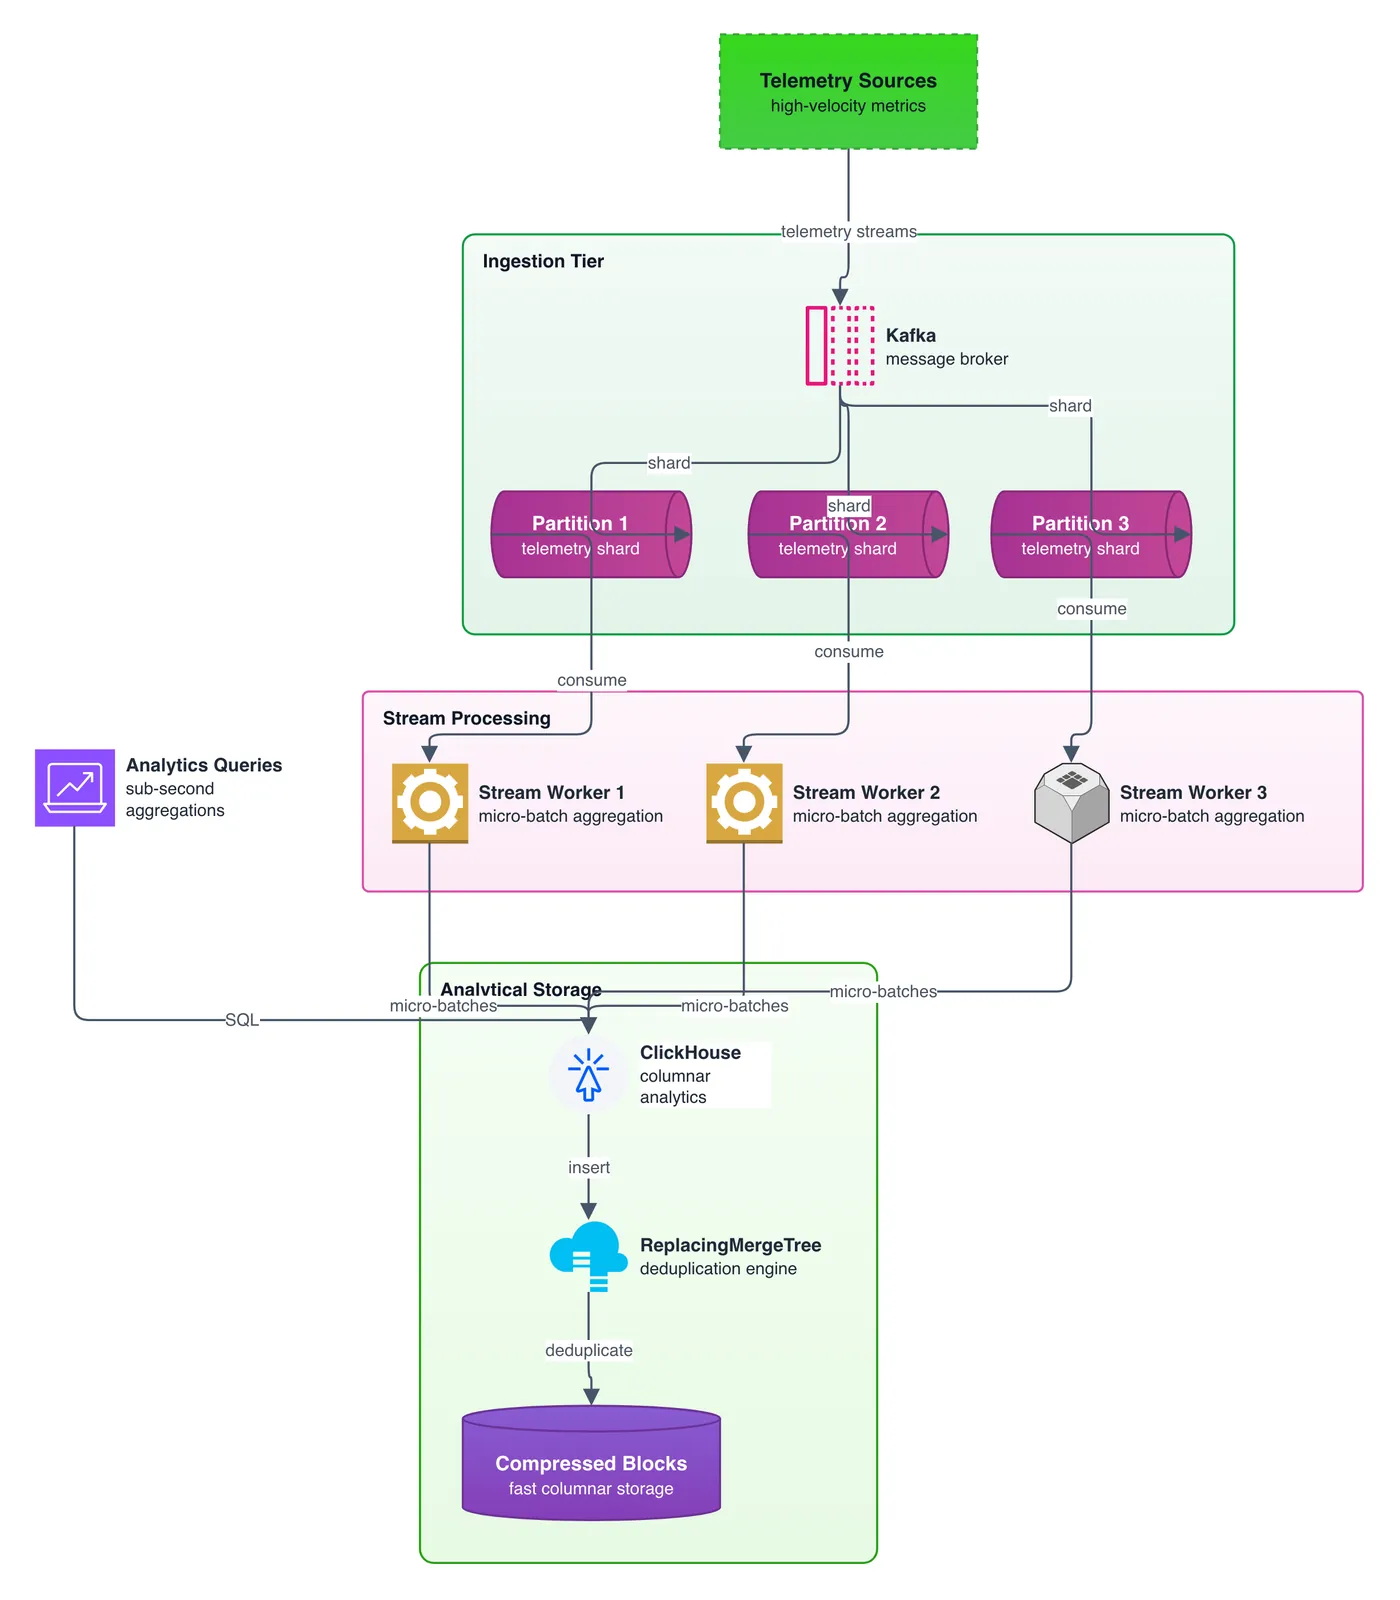
- Kafka partitions decouple high-velocity ingestion from analytical storage.
- Stream workers aggregate metrics into micro-batches for efficient I/O.
- ReplacingMergeTree deduplicates data into fast columnar compressed blocks.
The takeaway
Buffer high-frequency writes with Kafka and leverage columnar engines for sub-second analytical queries.
- #DataEngineering
- #Kafka
- #ClickHouse
- #BigData
- #SystemDesign
- #Analytics