WSJF Prioritization Matrix
Product Management diagram · made in Skemio
What it shows
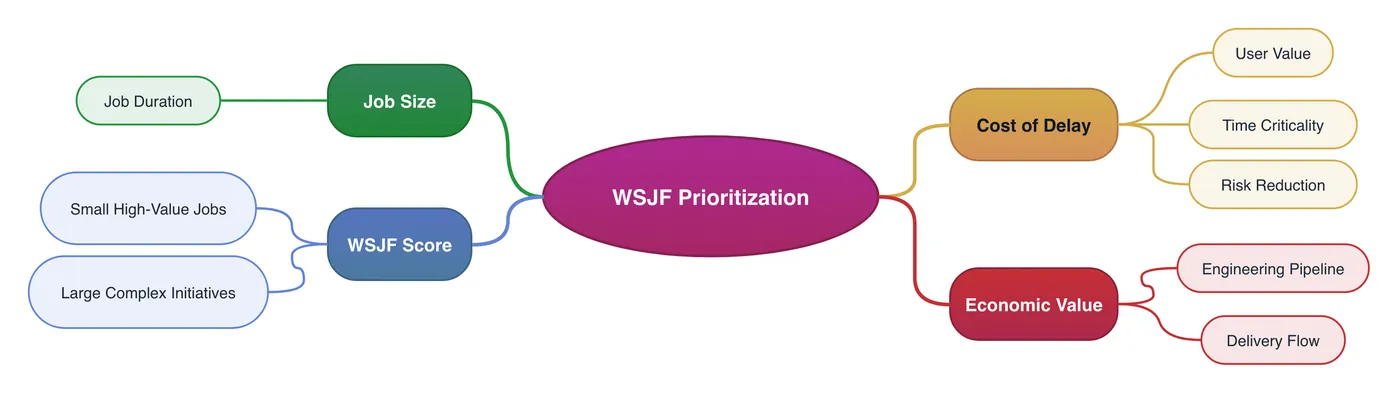
- Cost of delay combines user value, time criticality, and risk reduction.
- Dividing by job duration surfaces small high-value jobs immediately.
- Prevents large complex initiatives from choking engineering pipelines.
The takeaway
WSJF maximizes economic throughput by dividing total Cost of Delay by job duration.
- #WSJF','#AgileMethodology','#ProductManagement','#LeanPortfolio','#CostOfDelay','#Scrum